
Metabolic Wellness
Call to Schedule Your
Metabolic Wellness Appointment
970-787-9647
Bone Density Testing
DXA is a fast, convenient, precise, and painless way to measure bone density to determine a patient’s risk of developing osteoporosis. The sites to be examined are the fracture-prone hip, spine, and sometimes the forearm. Bone Mineral Density (BMD) is calculated and compared to normal BMD Values. It is then matched for age to confirm or exclude osteoporosis. A low BMD by DXA may predict the likelihood of having a fracture and can help determine a treatment plan. A report will be sent to your doctor that consists of your bone density measurements, a comparison of your results against a database of other patients your age, and will have recommendation for treatment or prevention.


Vicki Cayo
RT®, CT, MRI, CBDT,
Certified Bone Densitometry Technologist

Melisa Hehmann
CBDT,
Certified Bone Densitometry Technician
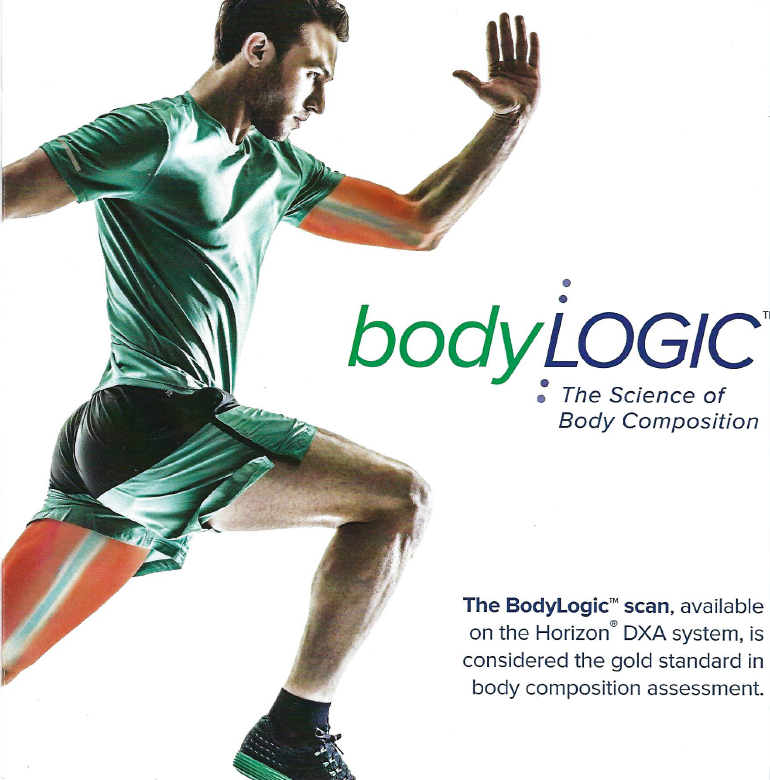
Body Composition Analysis
Inner Core (tm) visceral adipose tissue (VAT) assessment: The Advanced Body Composition report offers comprehensive and precise measurements of the body, including the precise location of bone, fat and muscle mass.
Abnormalities in the body composition are a key risk for obesity-related diseases, including diabetes, high blood pressure, metabolic syndrome, increased lipids and cardiovascular disease. Often Body Mass Index (BMI) is used to diagnose obesity, but it measures excess weight, not excess fat. It doesn't tell a complete story.
DXA scans clearly differentiate between fat and lean muscle mass, providing more accurate and detailed measurements of body composition. These measurements are critical for accurately assessing the state of your health and defining successful treatment programs.
What are the Adipose Indices on the Advanced Body Composition report and how are they used? When looking at the Adipose Indices on the Advanced Body Composition report, keep in mind that the lower the numbers in the AM (Age Matched) percentile column, the less fat there is compared to others of the same age. More specifically:
Total Body% Fat: Indicates fat mass/total mass.
Fat Mass/Height: (Fat Mass Index) This is more accurate measure of obesity than Body Mass Index (BMI) because it calculates the amount of fat you have relative to your height instead of total weight relative to height. The higher this number, the more fat you have.
Android/gynoid ratio: This measurement indicates whether you are an "apple shape" vs. "pear shape," with "Android" meaning abdomen and " Gynoid" meaning thighs. A value >1 indicates a client is more "apple shaped" which could mean a higher risk for cardiovascular disease, while a value <1 indicates more of a "pear shape".
% Fat trunk % Fat legs and Truck/limb Fat Mass Ratio: While these measurements aren't vitally important to everyday health monitoring, they demonstrate the distribution of fat in a client's body and can be used clinically to track lipodystrophy.
EST VAT Area (cm2) : This is a measurement of visceral fat, the "bad fat" around the insides of organs. VAT area (cm2) > 100 cm2 has been shown to be associated with an increased risk of metabolic syndrome and coronary heart disease.
Lean Indices on the Advanced Body Composition report.
When looking at the Lean Indices on the Advanced Body Composition report, keep in mind that the higher the numbers in the AM percentile column, the more muscle there is compared to others of the same age. More specifically:
Lean/Height2 = Lean Mass Index: Amount of lean mass a client has relative to height. The higher this number, the more muscle they have.
Appen. Lean/Height2(kg/m2) : The measurement of functional muscle in a client's appendices (legs and arms) relative to their height. This value is linked to physical performance and is used clinically to monitor sarcopenia or other muscle disabilities. The higher the number, the more functional muscles you have.
Why is this °/4, of body mass higher with the BodyLogic scan? Other methods, such as calipers or BodPod measure much less.
The BodyLogic scan is so accurate that it measures all fat in the body, both essential fat and storage fat. Storage fat is the fat you want to lose, but humans need a certain amount of fat to survive, this is called "essential fat." It is found in places like cell membranes, the central nervous system, the heart and lungs and digestive system. On average, about 4% of body fat in men and 12% body fat in woman is considered essential fat.
What are normal and not-normal values on a BodyLogic scan?
For Total Body%, use the age matched graph on the top of the Advanced Body Composition report as a reference. If you fall in the dark blue area, that means you are leaner that 50% of people your age. If you fall in the light blue area, that means they have more body fat than 50% of people in that age range. The line in the middle is equal to the mean body fat % for their gender.
